Prof. Upinder S. Bhalla - Ribosome translational forces
Ribosome translational forces: simulation examples
Sinha, D.K., Bhalla, U.S., and Shivashankar, G.V.
National Centre for Biological Sciences, Bangalore, India.
email: shiva [at] ncbs [dot] res [dot] in, bhalla [at] ncbs [dot] res [dot] in
Here are some simulations performed for the analysis of ribosome forces.
Contents
Basic model of luciferase gene expression and detection.
Models of translationally obstructed gene expression.
Simplified transcription model.
Model of luminescence.
NoOligo.g : Basic model without any block by complementary oligonucleotides.
Basic model reaction diagram.
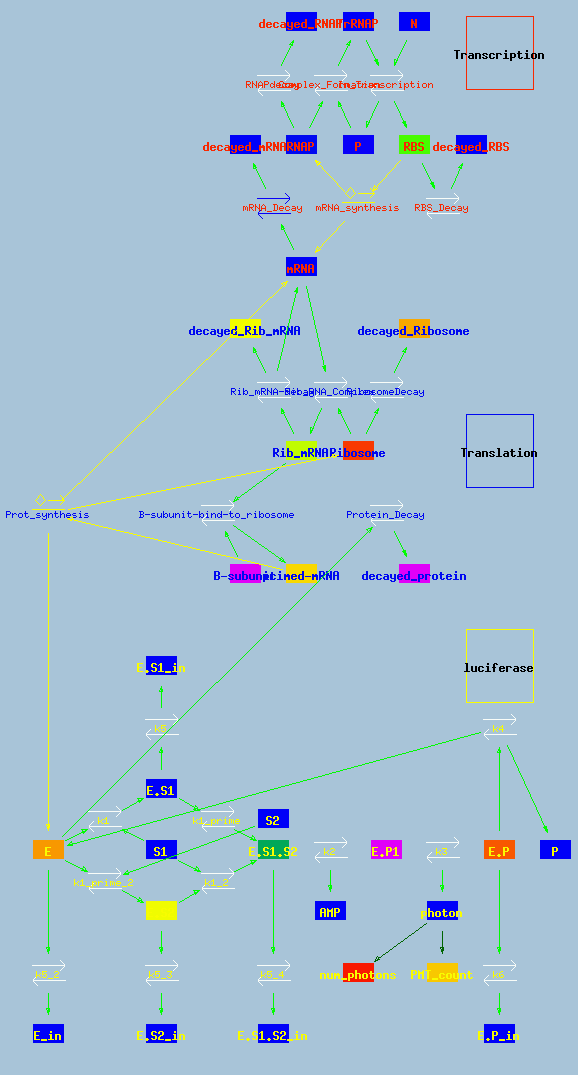
Above is the reaction scheme of the model. There are three modules: Transcription, translation, and luciferase. The Transcription model is based closely on the model by Kierzek et al. 2001 JBC 276(11):8165-8172, which is available in the DOQCS database.
The Translation model is derived to explain the experimental observations in this paper.
The Luciferase model is identical to the model of Yu Brovko et al 1994 Biochemistry (Moscow) 59(2):195-201 and is also stored in the DOQCS database.
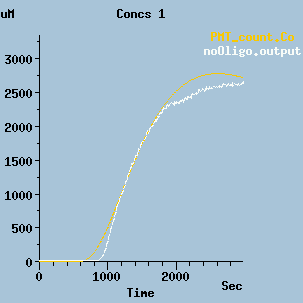
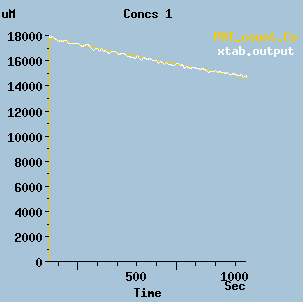
Output of the model.
This is a plot of the output of the model. In this simulation, the reagents are mixed at time=0, and after some dead time the PMT begins to detect photons. The orange line is the simulated photon count, and the white line the experimentally observed photon count.
In the model the calculations give the total number of photons. Note that the PMT count as displayed here is the rate of change of this total.
Oligo30.g : Obstructed translational model.
It has only a couple of minor changes with respect to the basic model. The rate of input to the Prot_synthesis step is reduced due to the presence of oligomers that bind to the mRNA and impede the progress of the ribosome. In this case a 30-mer oligomer is added which introduces a 2-fold decrease in synthesis rate and resultant photon counts.
Oligo45.g : Obstructed translational model.
This version has a 45-mer oligomer. This causes a very large decrease in synthesis rate and photon count.
transcription.g : Simple transcription model.
This version replaces the entire transcription module with a pool of DNA and a forward reaction representing transcription.
Luminescence.g : Model of luminescence module.
This model considers the luminescence steps for Luciferase in isolation, and compares with experimental PMT readings.